


Dow, DJIA, Nasdaq 100, NDX Price Analysis
- Over the past few months the Nasdaq 100 has generally outperformed the Dow Jones Industrial Average.
- So far this week, those fortunes have flipped as the Nasdaq is working on its second consecutive down-day while the Dow has, so far, rallied through both sessions.
- Is this observation a sign of a top or is this more of a re-load scenario for the Nasdaq 100 as the laggard Dow continues to be bid?
Don’t Call it a Comeback
It’s been a fairly amazing past two months across US equity markets. After US equity indices lost more than a third of their value in a little over a month, an onslaught of government stimulus programs have helped to not only reverse the trend but to push US stocks right back towards those prior all-time-highs. And with low rates for the foreseeable future combined with a Central Bank that’s very willing to do what’s needed to keep financial markets running smoothly, such as Jerome Powell highlighting that there’s ‘no limit’ to what the Fed can do with the lending programs available – it appears that the fear that had driven into markets so aggressively just a couple of months ago has now faded away.
Nasdaq 100 Daily Chart: Back Towards All-Time-Highs
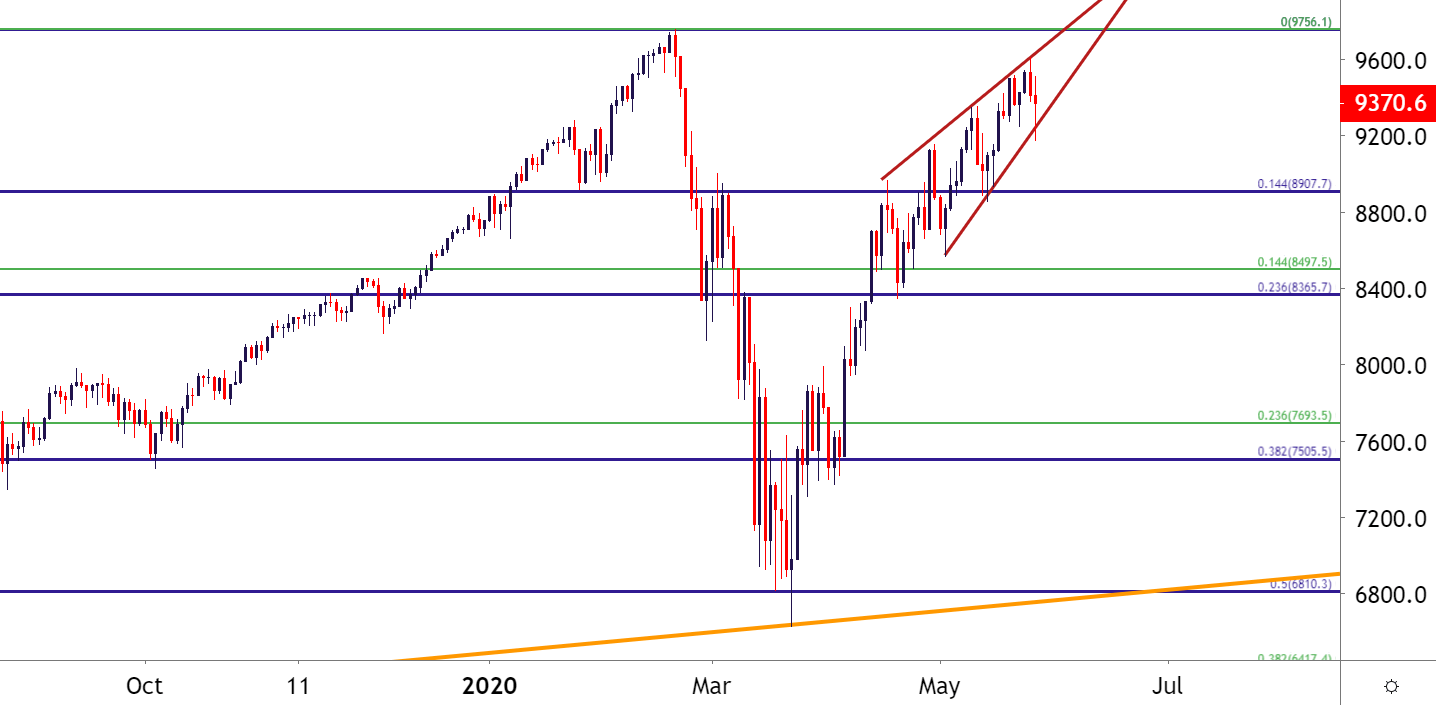
Chart prepared by James Stanley; Nasdaq 100 on Tradingview
And to be sure, there’s much to be optimistic about. In the, US a number of areas are beginning to reopen in anticipation of the summer. The recent Memorial Day weekend went through without any nasty headline surprises, as we’d become accustomed to over the past couple of months; and there’s even hope for a vaccine sooner rather than later, given investors and traders a number of reasons to continue driving stock prices higher.
But one key observation cannot go unnoticed, and that’s the fact that so far this week, the high-flying Nasdaq 100 has cooled considerably even as the Dow Jones Industrial Average has continued to rise. Until recently, this was very much the opposite scenario – as the tech-heavy Nasdaq out-performed the DJIA both on the way down in February-March and on the way back up in the two months since.
Dow Jones Daily Chart: Retraced 61.8% of Sell-Off So Far
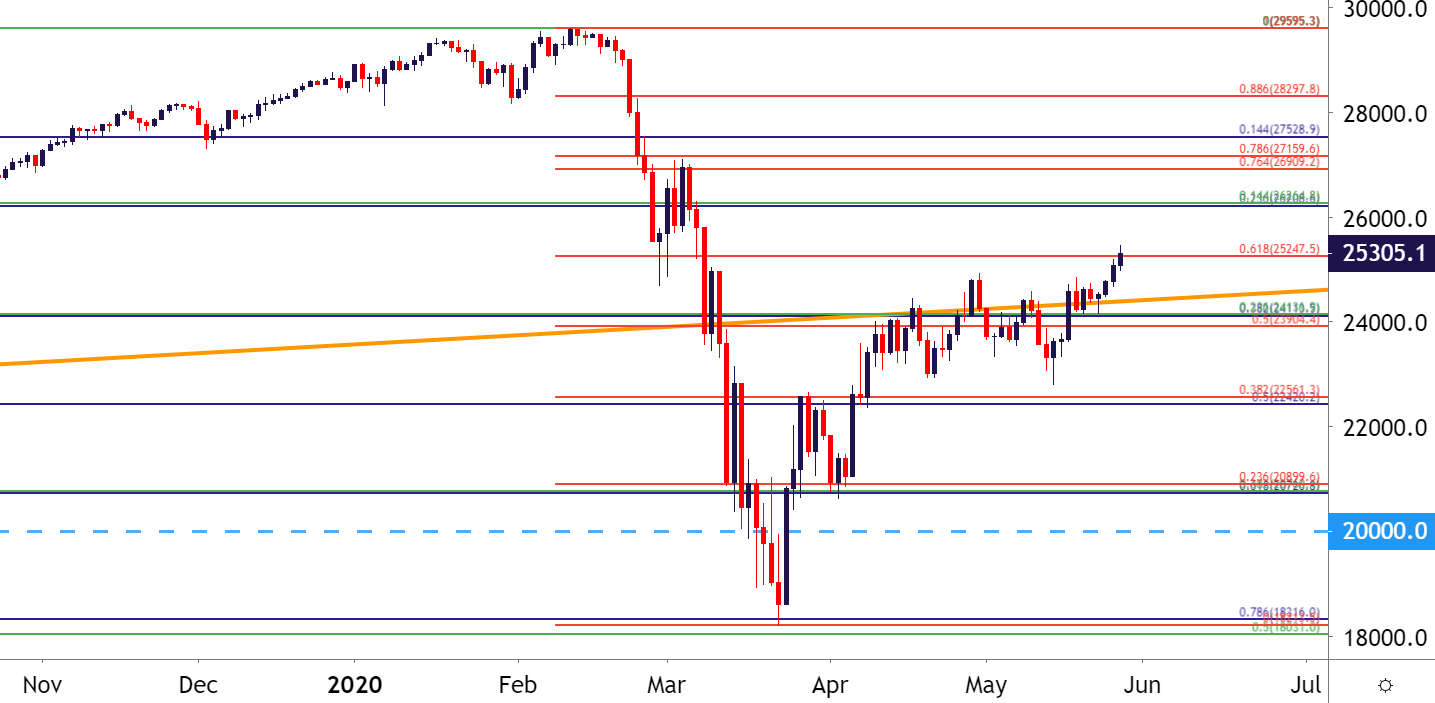
Chart prepared by James Stanley; Dow Jones on Tradingview
To make this an apples-to-apples comparison: From the February highs down to the March lows, the Nasdaq 100 lost approximately 32.05%. The Dow lost 38.5% over the same period of time. And on the way back up – the tech-heavy Nasdaq 100 continued to outperform, rising by as much as 44.9% while the Dow has rallied by as much as 39.7%. Neither of those two-month-return numbers are anything to sneeze at – but it does clearly illustrate how the Nasdaq has continued to outperform the Dow over the past couple of months – until this week, at least.
Risks on the Horizon
It seems that everywhere one might look for insight into the novel coronavirus or the related market effects are filled with politically partisan vitriol, on one side or the other. The truth of the matter is that nobody really knows how this whole thing is going to play out. We’ve never seen a pandemic of this scale in most of our lifetimes; and any historical examples of prior pandemics, such as what happened in 1918 are poor comparisons as there is so much difference in the surrounding context.
What does seem a bit more certain is the implicit support that’s been voiced by the Fed and more recently, other Central Banks. So the case can be made that Central Bank support is probably a much more important driver to current risk trends than the day-to-day headlines of another possible vaccine or another potential re-opening. It seems that most scientists are in agreement that this virus will be problematic until a vaccine is found, and this would necessitate continued strategies of social distancing which, in-turn, impacts business expectations.
So the big question here is whether the Fed, US Treasury and Congress can trigger enough stimulus to offset the near-certain slowdown that will continue to emanate from that effect; and on the other hand continuing to hope that another nasty risk factor doesn’t rear its ugly head – like something around commercial real estate as many businesses have reportedly stopped paying their rent and many customers are just going to continue to shelter-in-place.
For near-term dynamics – the Nasdaq 100’s sell-off this week has pushed prices down to a key area of possible support, taken from the 14.4% Fibonacci retracement of the 2018-2020 major move. Should bulls continue to defend and protect this area of support on the charts, the possibility for bullish continuation and perhaps even a re-test of those prior all-time-highs could remain on the cards.
Nasdaq 100 Four-Hour Price Chart
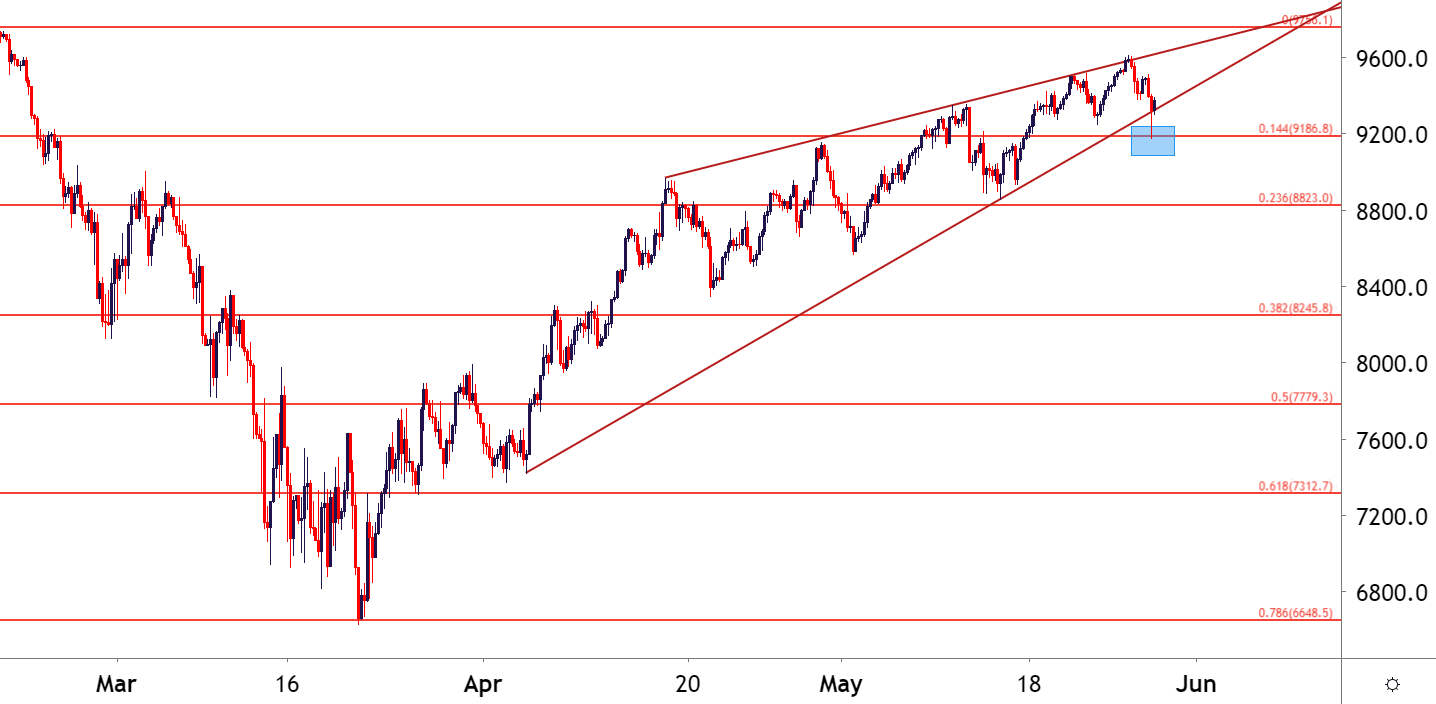
Chart prepared by James Stanley; Nasdaq 100 on Tradingview
— Written by James Stanley, Strategist for DailyFX.com
Contact and follow James on Twitter: @JStanleyFX