

More than 42,500 students from nearly 400 public and private schools across the country participated in this year’s Monitoring the Future (MTF) Survey of drug use and attitudes among American 8th, 10th, and 12th graders. Encouraging trends continue to be seen for cigarette use, with past month use down by approximately 20-30 percent compared to the mid-1990’s. Declines were seen in five-year trends of lifetime, past year, past month and binge alcohol use and in overall rates of lifetime, past year and past month illicit drug use, excluding marijuana, among 10th and 12th graders. Notably, misuse of prescription opioids among high school seniors is at its lowest rate since the survey began assessing it. Despite these promising trends, the 2019 MTF results show a continued dramatic increase in vaping.
Image

Some of the most common reasons that high school seniors reported they vape are to, “experiment”, “because it tastes good”, “to have a good time with my friends”, and “to relax or relieve tension.” Over the past year, the two-fold rise in the percent of 12th graders that say they vape because they are “hooked” is of particular concern. This report supports other published findings that flavor additives, especially sweet flavors like fruit and mint, are appealing to youth. Overall, reported rates of past month vaping appear to exceed any other kind of substance use, including alcohol and marijuana, for all three grades; and in each grade past year vaping is second only to alcohol.
Image

Vaping
In 2014, the MTF survey introduced questions about electronic vaporizer devices. In 2015, participants were asked what they thought they were vaping, and in 2017 questions specifically about vaping nicotine, marijuana, and “just flavoring” were added.
Results from this year’s survey reveal significant increases in vaping by all grades. Past month use of any vaping increased from 21.7 to 25.0 percent among 10th graders and from 26.7 to 30.9 percent among high school seniors—that means one in four 10th graders and one in three 12th graders qualify as current users of vaping products—and most report using the JUUL specific brand. Moreover, 82.0 percent of high school seniors report that vaping devices are easy to get.
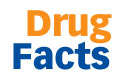
When asked to report on what they are vaping, most teens say nicotine. Past month nicotine vaping has increased annually and more than doubled from 2017 to 2019 in all grades. This year, 9.6, 19.9 and 25.5 percent of respective 8th, 10th, and 12th graders reported vaping nicotine in the past month. Interestingly, the percent of teens that think it is risky to vape nicotine has increased over the same 2-year period but remains low. In 2019, 21.4 percent of high school seniors reported that that there is great risk of harm from occasionally vaping nicotine and 38.0 percent reported great risk of harm from vaping nicotine regularly. Similar differences were also seen among 10th graders (20.5 percent reported thinking it is harmful to vape nicotine occasionally versus 39.9 percent who reported perceiving harm in regularly vaping nicotine) and 8th graders (21.5 percent versus 41.9 percent). As with vaping devices, a majority of 12th graders, 80.4 percent, reported it is easy to get e-liquid with nicotine for vaping.
Image

The percent of teens that reported past month marijuana vaping also rose, from 2.6 to 3.9 percent of 8th graders; 7.0 to 12.6 percent of 10th graders; and from 7.5 to 14.0 percent of 12th graders. This increase in past month marijuana vaping in high school seniors is the second largest single-year increase ever measured in the 45-year history of the MTF survey, and was only surpassed by the increase in nicotine vaping between 2017 and 2018.
Image
Unlike other vaping measures, a decline was seen across all prevalence periods in teen vaping of “just flavoring” among 10th and 12th graders, with 10.5 and 10.7 percent reporting past month use, respectively. It is important to note that students do not always know what is in the e-liquid they are vaping and labeling is inconsistent. The most popular brands on the market do not offer options that are nicotine-free, and research shows that teens are attracted to nicotine vaping by the flavored products they offer.
Other Nicotine and Tobacco Use
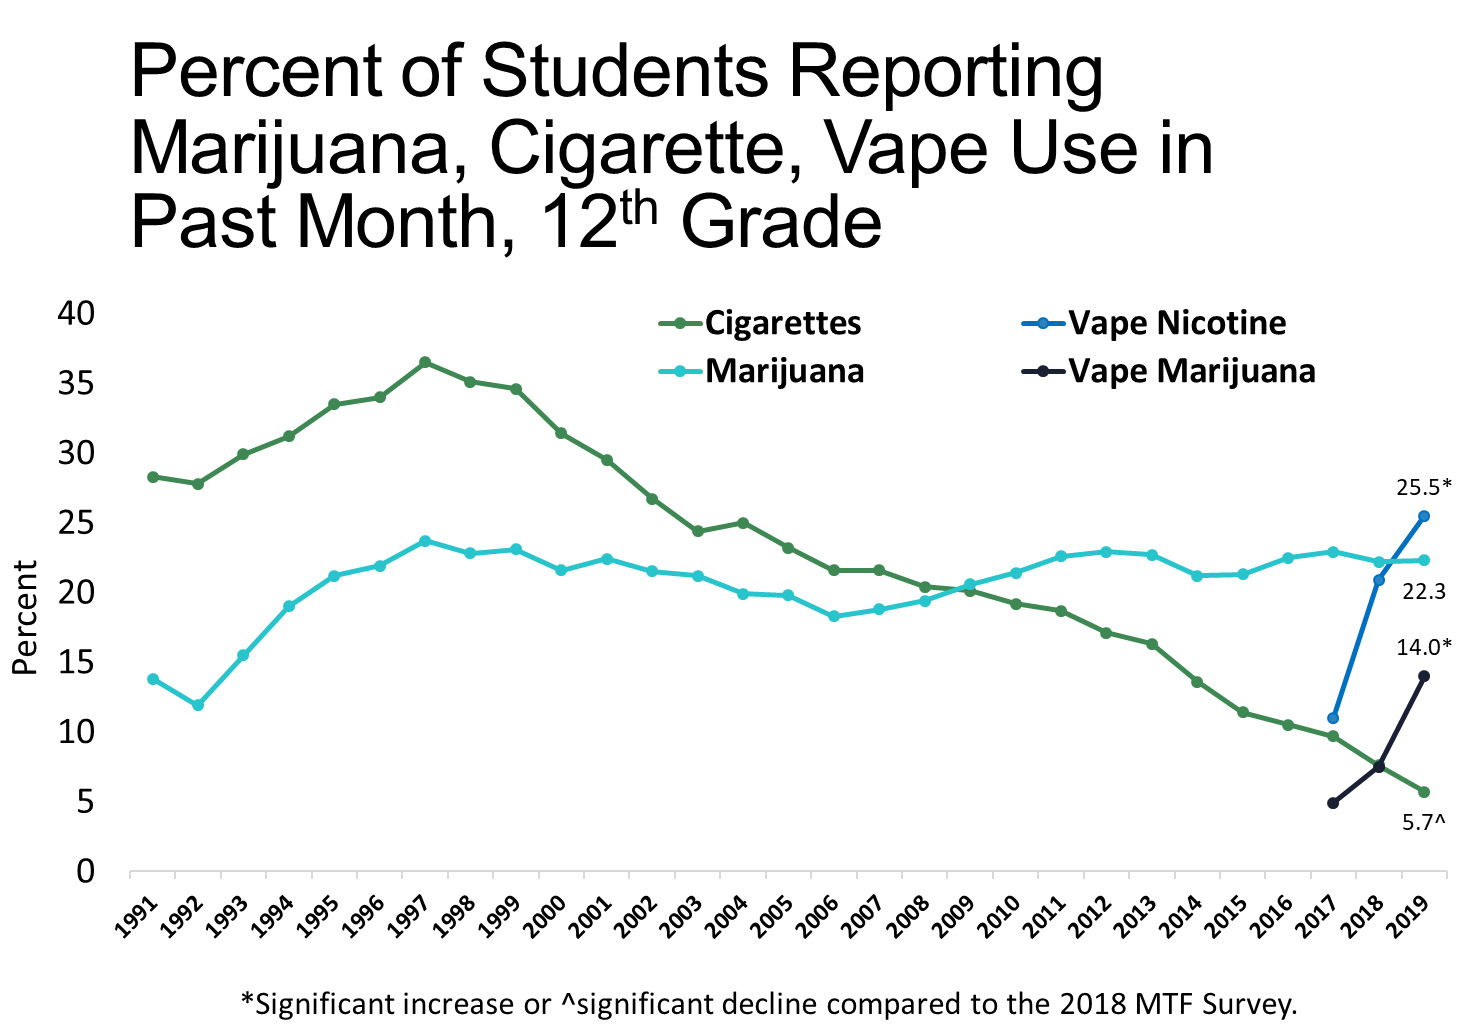
Cigarette smoking continued a downward trend and significantly fell among 12th graders reporting past month use, daily use or consumption of one-half pack or more per day. Past month cigarette smoking was reported by 2.3 percent of 8th, 3.4 percent of 10th, and 5.7 percent of 12th graders. Only 2.4% of 12th graders said they smoked cigarettes daily, a significant decline from 2018. However, this encouraging news is tempered by the 11.7% of high school seniors that said they vaped nicotine daily in 2019, the first year daily vaping use has been measured.
Significant five-year declines in cigarette smoking were reported by all grades and across all prevalence periods, including lifetime use. A 26 percent decrease was seen among 8th graders reporting lifetime use—from 13.5 percent in 2014 to 10 percent in 2019. Among 10th graders, there was a 37 percent drop in the same five-year period, from 22.6 to 14.2 percent. And among high school seniors, lifetime use fell 35 percent from 34.4 percent in 2014 to 22.3 percent in 2019.
Image
Reported use of flavored little cigars or cigarillos declined over the past five years in all grades with 2.2, 3.7, and 7.7 percent of 8th, 10th, and 12th graders reporting past month use, respectively; and this year, more teens in 8th and 10th grade think there is a great risk of harming oneself from regularly smoking little cigars or cigarillos, including those with flavor.
Past month use of tobacco using a hookah was reported by 1.3, 2.4, and 4.0 percent of respective 8th, 10th and 12th graders—a decline, compared to peaks in 2016, for all grades. Large cigars also saw a five-year decrease in 10th graders with 2.1 percent reporting past month use.
Marijuana Use
Past month, past year and lifetime marijuana use remained steady among 8th, 10th, and 12th graders. This year, 6.6 percent of 8th, 18.4 percent of 10th, and 22.3 percent of 12th graders reported past month marijuana use while 11.8, 28.8, and 35.7 of respective 8th, 10th and 12th graders reported past year use. When asked about how teens are consuming marijuana, 86.4 percent say they smoke it.
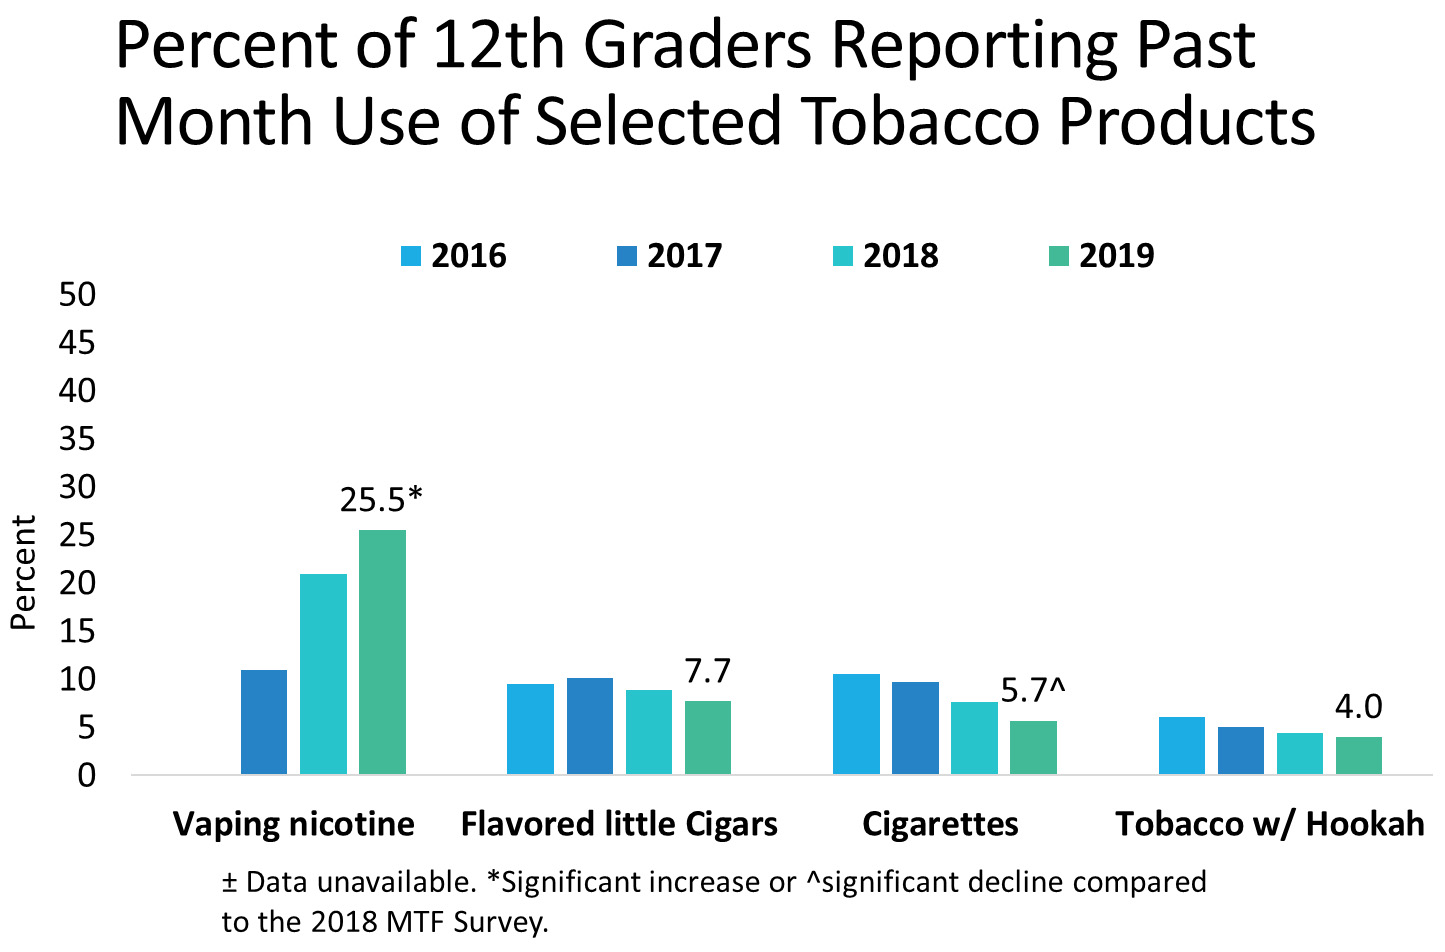
Daily marijuana use, however, increased among 8th and 10th graders. Daily use is defined as use on 20 or more occasions in the past 30 days and was reported by 1.3 percent of 8th graders, 4.8 percent of 10th graders and 6.4 percent of 12th graders. While these percentages may seem low, they represent an increase of 85.7 percent among 8th graders and 41.2 percent among 10th graders, compared to 2018. The percentage of teens who think that regular use of marijuana is risky has been trending down since the mid-2000’s. In 2019, 52.3 percent of 8th graders, 39.6 percent of 10th graders and 30.3 percent of 12th graders perceived great harm from regular marijuana smoking. Despite the expansion of state medical marijuana laws, the perception of availability did not change in the past year and long-term trends suggest a gradual decline in the percent of teens saying marijuana is easy to get.
Image
Alcohol Use
Lifetime, past year, and past month alcohol use and binge drinking continued to show significant five-year declines in 10th and 12th graders. Past month use of alcohol was reported by 7.9 percent, 18.4 percent, and 29.3 percent of 8th, 10th, and 12th graders, respectively. Among 10th and 12th graders, this reflects a respective decrease from 23.5 percent and 37.4 percent in 2014. Binge drinking (defined as consuming five or more drinks in a row in the past two weeks) also fell significantly among 10th and 12th graders between 2014 and 2019. This year’s survey found that 3.8 percent of 8th, 8.5 percent of 10th, and 14.4 percent of 12th graders reported binge drinking.
The percent of high school teens reporting lifetime alcohol use declined compared to peak years. Lifetime use was reported by 24.5 percent of 8th graders—a 56.1 percent drop from a peak of 55.8 percent in 1994. Among 10th graders, lifetime use declined by 40.2 percent from a peak of 72 percent in 1997 to 43.1 in 2019. And among high school seniors, 58.5 percent reported lifetime use in this year’s survey, a 28.4 percent drop compared to a peak of 81.7 percent in 1997.
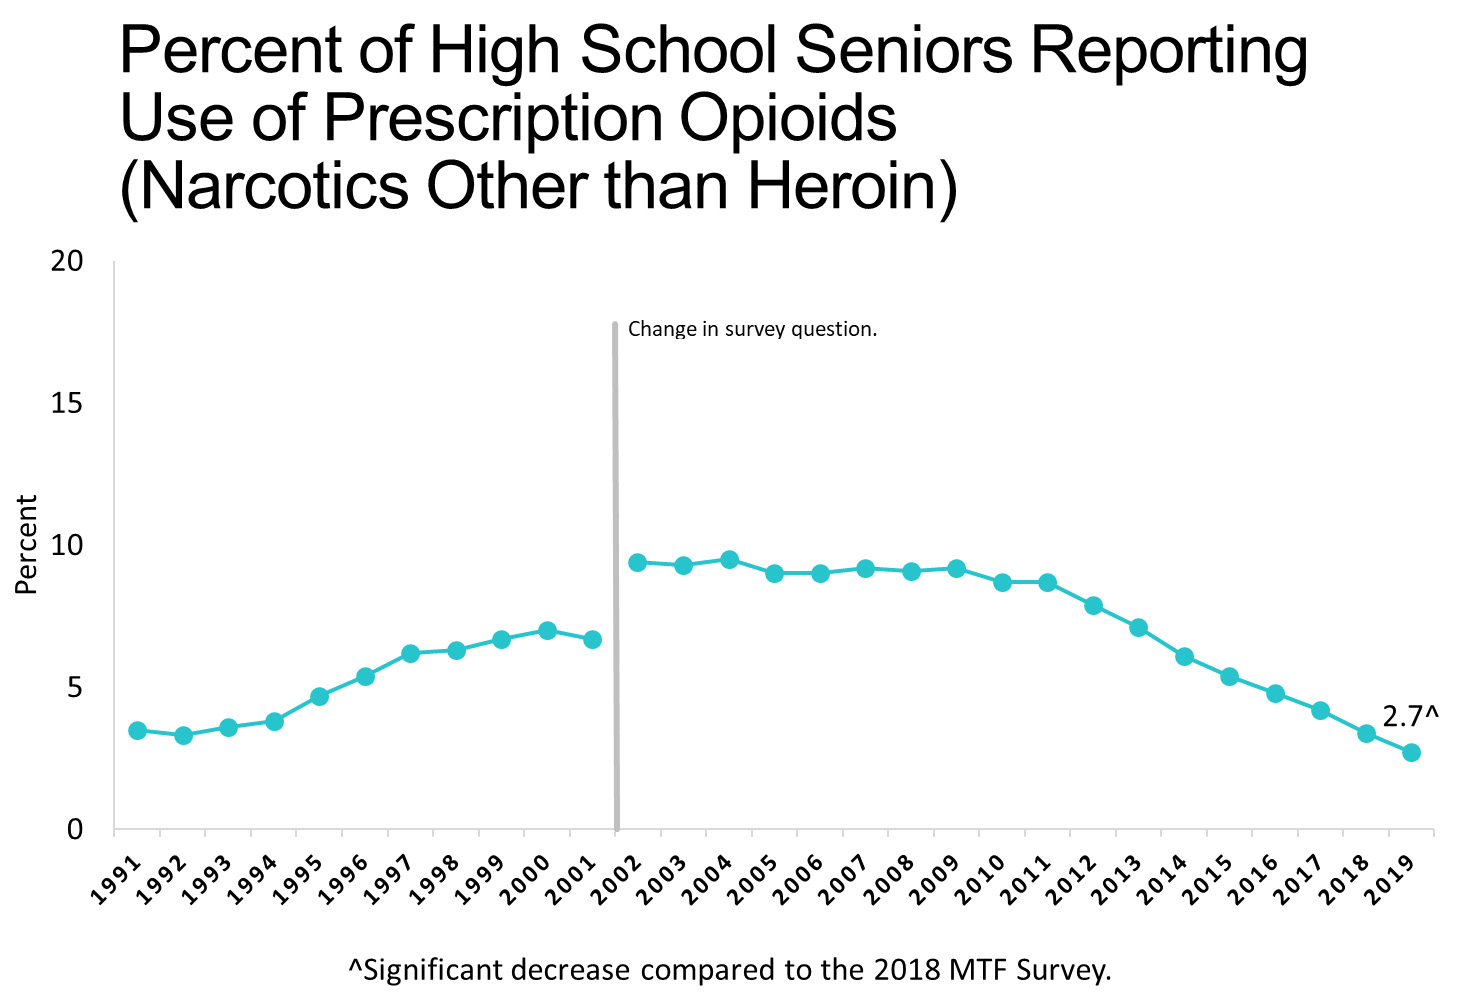
Opioid Use
Past year prescription opioid misuse (reported in the survey as ‘narcotics other than heroin’) continued a significant decline among 12th graders, with 2.7 percent reporting use in 2019. A significant five-year decline was reported for Vicodin among 10th and 12th graders and for Oxycontin among 12th graders. Past year use of Vicodin declined from 3.4 percent in 2014 to 1.1 percent in 2019 among 10th graders and from 4.8 percent to 1.1 percent in the same period among 12th graders. Oxycontin was reported by 1.7 percent of 12th graders in 2019, a nearly 50 percent drop compared to 3.3 percent in 2014. Rates of prescription opioid misuse are now at their lowest levels since they were first recorded by the survey. In addition, heroin use remains low with five-year declines in past year use from 0.5 percent in 2014 to 0.3 percent in 2019 among 10th graders and from 0.6 percent to 0.4 percent, over the same period, among 12th graders.
Image
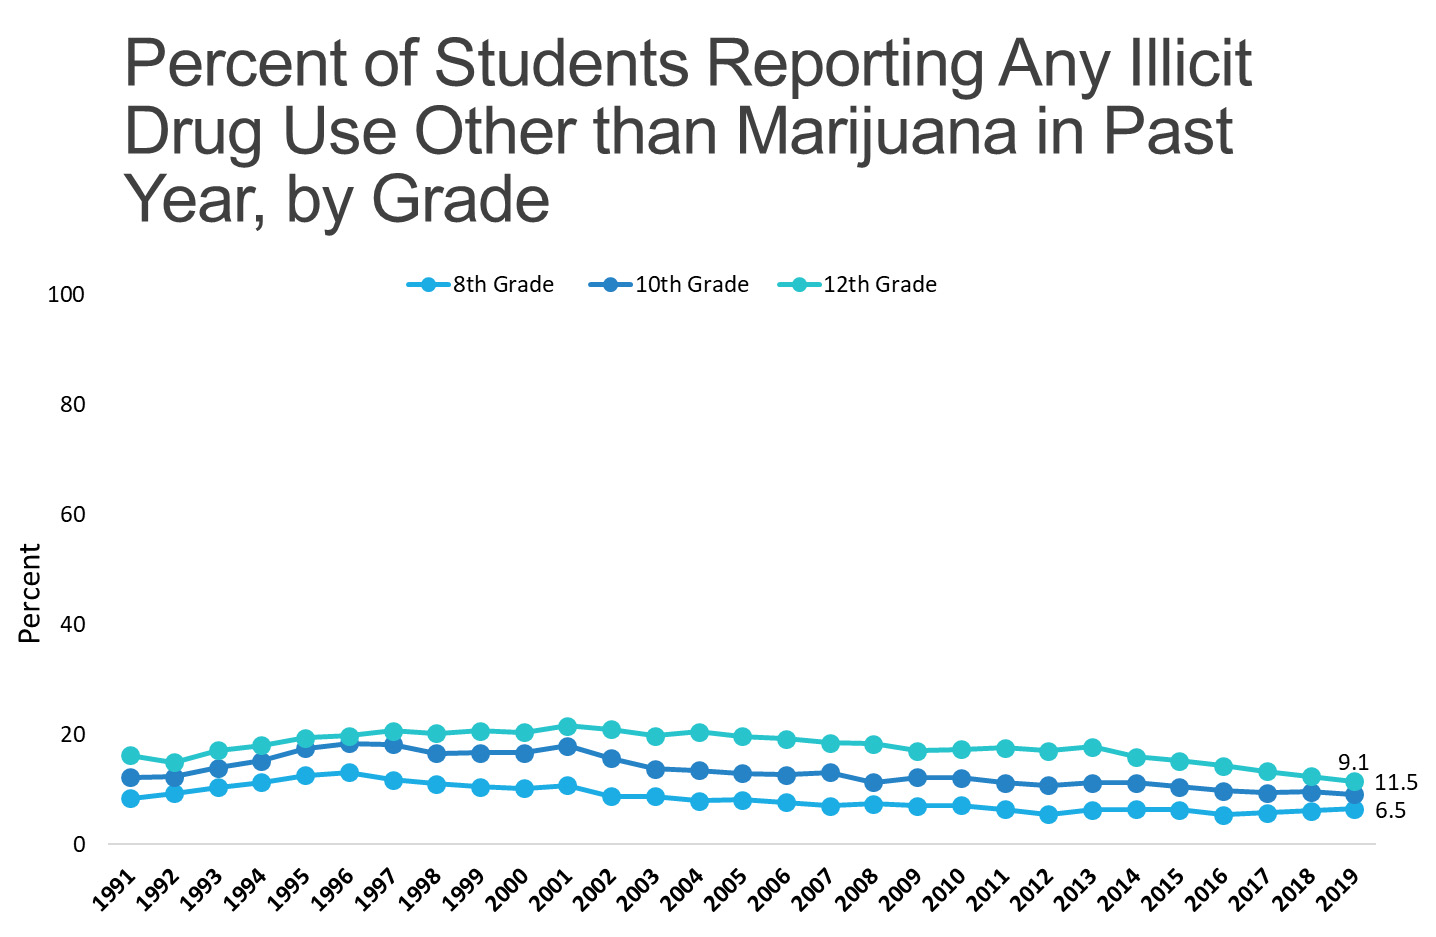
Other Illicit Drug Use
Survey findings reflect steady rates of other illegal drug use in this population, including cocaine, methamphetamine, and over-the-counter cough and cold medicines. Past year use of cocaine was reported by 0.7 percent of 8th graders, 1.5 percent of 10th graders and 2.2 percent of 12th graders. While use has remained low, there has been a gradual decline in the percent of 12th graders that perceive great risk from trying cocaine once or twice; from 54.4 percent in 2013 to 48.0 percent in 2019. Methamphetamine use remained low and steady, with use across all prevalence periods at less than 1 percent in all grades.
Minor changes were seen in the use of amphetamines, LSD and synthetic cannabinoids. The lifetime and past month use of amphetamines remained steady from 2018 to 2019, but past year use decreased among high school seniors and a five-year decline in past month, past year and lifetime use was reported by 10th and 12th graders. Five-year increases were seen in lifetime use of LSD in all grades, in past year use in 12th graders and in past month use in 10th graders. The past year use of synthetic cannabinoids (also called spice/K2 or synthetic weed) saw a five-year decrease from 5.4 to 2.6 percent among 10th graders and from 5.8 to 3.3 percent among 12th graders; but saw a one-year increase by 8th graders, with 2.7% reporting past year use.
Image
Learn More
For more information about the Monitoring the Future survey and results, please visit:
This publication is available for your use and may be reproduced in its entirety without permission from NIDA. Citation of the source is appreciated, using the following language: Source: National Institute on Drug Abuse; National Institutes of Health; U.S. Department of Health and Human Services.